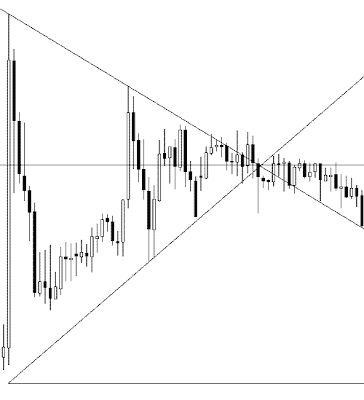
Well, my posts are few and far between these days.In case anyone else is still following long here is some good information on the 3hr AUDJPY.We have a nice symmetric triangle going all the way back to November 25th.See?I'm expecting this to break (upward) and then run into a downward sloping resistance line on the 1d AUDJPY. However, we'll have to wait and see. I've been wrong (more than a few
30 Nov 2009
While I realize the world went through a bit of an unwind, before and after the Dubai incident, I've been busy with work and family issues instead.Things have just been incredibly busy!In any case, what with the volatility and unwinding that has been going on it's probably a good time to be inactive. I did manage to blow up my small discretionary account (my robots are far better traders than I
13 Nov 2009
I've been leery of letting BREAD (my primary trading robot) trade too much. I suspect prior tweaks have it taking too much risk. As such I kept it on a short leash and it only earned 0.9% for the week. Perhaps I'll have time to make some adjustments over the weekend.On the discretionary front I was back down to a more reasonable 13% this week. Last week's 34% was probably some type of market
11 Nov 2009
I'm looking at a short term chart, but the lack of volatility suggests that something is in the air.Even with the recent good news from China things have been relatively lethargic.The daily chart is also showing the potential to have a few down days.This seems like a good time to manage risk.UPDATE: This evening, while I was on the road, I see that we had a nice spike upwards, hitting my
10 Nov 2009
My last post showed a profitable overnight setup based on a week long support line on the 1hr chart.Here, I've got an example of a support becoming resistance once it has been violated.Take a look at the following 15min chart:See the violation around 9:00pm last night? As an aside, this was a good point to try a well protected short. Overnight we tested a longer term support line (see my
9 Nov 2009
Since I'm awake I thought I'd point out a price alert.The AUDJPY currency pair is testing a support line.A long tail break (closing on or above the support line) would still be a bullish sign.Anywhere, here's a recent 1hr chart snip.This is a good place to look for a trade. Good luck.NOTE: See the previous post... it shows the support line valid since November 1st.UPDATE: Upon waking this
Price action is a type of technical Forex trading that is based on the bare prices and charts instead of the usual indicators. Traders that employ various price action trading techniques believe that bare prices and charts can tell us everything we need and that indicators, while being helpful for calculating some statistical dependencies, create a time lag that can be critical in Forex. In fact, all indicators and any other methods are based on the data that is a part of a price action. So, price action is just a broad definition for the rather raw technical market data. The four techniques that are presented here aren’t the full set of price action trading instruments; they are just the most popular and interesting ones.
Tape Reading. The term refers to the times when the stock quotes came to the trading houses (more like the modern betting firms) in a form of a tape telegram. Traders analyzed the changes in the quotes, their speed and volume and, basing on this analysis, issued their trade orders. Modern tape reading in Forex is somewhat different — you just analyze the quote as it’s displayed in your broker’s terminal and then trade using your analysis of the data. It’s the most basic way of trading and some new traders start from it without knowing how is it called. Tape reading is mostly suitable for scalping and can’t be used for the long-term entries.
Japanese Candlestick Patterns. Many different patterns, formed by the Japanese candles, are recognized by the Forex traders. Such patterns are usually quite small (they consist of 1 to 4 candles) and can be spotted on all timeframes. Japanese candlestick patterns aren’t too reliable but the abundance of symbols compensates the low winning rate. This type of trading is a part of price action but it requires some basic chart analysis.
Chart Patterns. Patterns formed by the price fluctuations of the chart are numerous — triangles, wedges, double-tops, double-bottoms, head-and-shoulders and many others are all part of this trading technique. Opposite to the Japanese candlestick patterns these patterns are usually formed by many chart bars and often serve only for the long-term market evaluation. Chart patterns sometimes have a strong fundamental basement and are thus valued by the professional traders and the Forex market tends to «follow» them simply due to their popularity.
Point-and-Figure Charts. This type is a bit more difficult than everything else in the price action domain. It’s also arguable that point-and-figure can be considered a price action technique at all. P&F charts are built based on the price changes, independently on time. The columns of X’s are formed when the price is rising, while the columns of O’s are formed during falling trends. The columns of X’s and O’s follow each after another. A price should pass a certain amount to form an O or X or reverse in an opposite direction for a significantly higher amount to start forming a new column. Trends can be easily read in such charts and many Forex traders use the strategy to buy and sell exactly at the new column’s start to catch the new trend.
Not all traders can use price action techniques successfully, the same as not everyone can trade with the indicators profitably. Price action can be used alone but it also can be interesting for other methods’ confirmation. With price action techniques you can always scale in and out and flexibly change your strategies as well.
8 Nov 2009
What the heck, I may as well jump out on a limb and let you know what I'm seeing with the AUDJPY.Basically, if you look at the chart, we've had a good support line since the beginning of November.Now, if I've got the right chart uploaded, take a look below:Personally, I'd suggest taking a long position when the price approaches the support line. You can set a nearby stop and protect yourself
6 Nov 2009
Since the trading robot, BREAD, was predominantly sidelined for the last couple of weeks I felt the need to do more discretionary trading.While the capital used wasn't very large it felt great to pull in a 34% increase over the course of the week. If I could scalp like this all the time it would definitely spell the end of the day job. I have dreams of setting up a trading office with spacious
5 Nov 2009
It takes a lot of fortitude to use them but I think the signals blog is proving itself useful.For example, right now we seem to have established a bottom in the recent AUDJPY downward movement.So, especially under such a condition, we get good results if we see a signal and then look for confirming behavior. Basically, the signals are great lead-ins to a period of analysis.No, they aren't all
30 Okt 2009
With the recent downward move in the AUDJPY my robot has been sidelined. No big deal really but it does point to a possible correlation as I'd noted earlier. After a very good robot week, perhaps with behavior characteristic of a local top and massive robot profit, the market takes a downturn. There are only two data points so far but I'm definitely staying on the lookout for this. Above
27 Okt 2009
Just a short note to let you know that my new signals blog is online. Obviously this is a use at your own risk situation.Robot Price AlertsAnyway, when my robots notice various conditions they will post a message concerning the event in question.The only notice type currently active may identify a situation that will either have a short term AUDJPY price rise offering a scalping opportunity or a
25 Okt 2009
The BREAD trading robot has had a minor tweak during this last weekend.To make a long story short, another risk modification metric has been defined. If things work as planned this will give the robot the ability to trade over a wider currency pair price move. Obviously, the plan is to simultaneously maintain the same level of profitability.My initial readings on quantitative analysis, via
It has been more than a few years since I've had to apply any serious math skills towards my work. However, I have noticed some discussion of quantitative analysis in a few forex forums as well as job listings posted for quants.For a very general introduction to this concept here are some links from Wikipedia:Stochastic calculusItō calculusMonte Carlo option modelStochastic
23 Okt 2009
Things are going well. As you can see BREAD (Basic Robot Earning All Day) is starting to look like a winner. Return Day 0.1900% Sun 13 September 3.2339% Mon 14 3.1616% Tue 15 3.2615% Wed 16 2.1510% Thu 17 0.4442% Fri 18 --------------- 13.05% 0.1850% Sun 20 2.0259% Mon 21 0.9016% Tue 22 1.1536% Wed 23 0.2460% Thu 24 0.1338% Fri 25 ----------
21 Okt 2009
Two titans of the forex robot trading industry are squaring off in the search for higher profits.In the green corner we have BREAD (Basic Robot Earning All Day) with consistent earnings of approximately 1.2% per day. In the other green corner we have the relatively new ARTFAB (A Rising Tide Floats All Boats) with very promising early results. Already today ARTFAB has locked in over 3.0%
20 Okt 2009
The AUDJPY has done a whole lot of nothing for the last few days.Can you blame it? It must be tired after the recent climb.More seriously, with the RBA considering whether to raise rates another 25 or perhaps even 50 basis points, I don't expect any type of calamitous drop.I think we might see a drop down to 83.00 again but if it does stop in that region I'd consider the range between there and
18 Okt 2009
I obviously have no guarantees but, according to my own proprietary reversal indicator, this is a potential reversal point.Again, do your own homework, but this is the "signal" I'll be posting to my alerts blog...UPDATE: It's about 9:49pm and the AUDJPY 1hr chart is showing a potential twin tail.UPDATE: It's 10:03pm and here's the 1hr chart right now...And here's the chart from my last post
The AUDJPY has been on an upward trajectory for a while now.There is no telling, at least not in advance, whether we'll see more massive upward movement due to hawkish statements from the RBA or not.However, here is a 3hr chart showing recent movements:Obviously, clear support and resistance helps identify some lower risk entry points.
16 Okt 2009
It's late Friday night, the markets are closed, and all through the house not a creature is stirring. Well, nobody but the scheming trader hatching up another robotic system.As someone who designs software systems for a living I can assure you that, in terms of making improvements, nothing is more helpful than watching a system in action. The key point here is the concept of "seeing" the results
15 Okt 2009
I'm starting to get more than a little cautious about the stellar increase in the AUDJPY over the last several days.While it's true that markets can continue to move higher or lower for long periods of time it's important not to get too caught up in recent events. In fact, though we all react to these things at different rates, you can consider it a warning whenever there is something to get
14 Okt 2009
I've had some success analyzing the AUDJPY over the last few days. In particular, whether by luck or otherwise I managed to spot some channels, one of them an apparent bull flag, a wedge leading to 82.00 and then predicting a breakthrough beyond that level.It's very rewarding to make an observation and then have results conform to your expectations.Anyway, I'm still letting my robot do my
13 Okt 2009
My last post focused on a short term channel.This time I'm looking at a longer term trend -- though still on the 1hr AUDJPY chart. This one looks like it might be a bull flag.It's always hard to tell. However, with future interest rate hikes expected, it's likely we'll continue our upward movement if signs of an Australian recovery remain strong.Here's the chart:Play safe.UPDATE: It's 7:00am
There's a channel on the AUDJPY 1hr chart.For as long as the channel decides to last we have an opportunity at either the top or bottom levels.Notice it going back and forth?This is perfect for my custom trading robot...Unfortunately, predictability never lasts.Well, that was nice. It's about an hour and half later... see the bounce? Click the image to get a larger version...Are we going to
12 Okt 2009
Here's a snip showing the accumulation distribution on the AUDJPY since the 2nd of October.The recent test of the support line happened today near 2:30pm. Obviously, the fact that the RBA appears to be ready to continue a series of interest rate hikes appears to be driving this.I'm looking for this line to break.UPDATE: It's just after 6:30pm and I figured it might be nice to get a larger look
On weekends I like to either tweak existing robots or create new ones. While it's very early in the process I think the most recent tweaks are going to have a noticeable positive effect.I woke up around 4:00am this morning and thought I'd check on the computer. What did I see? A nice AUDJPY move from 81.10 to 81.50 for now. Anyhow, this weekend's tweaks were operating on the dip and return.
9 Okt 2009
Yes, for lack of a better name I am calling my robot BREAD. This is short for Basic Robot Earning All Day. It has been given minor tweaks from time to time but it still continues to follow the same system and strategy... taking advantage of constant price oscillations in the AUDJPY. While the results don't look all that spectacular I invite you to investigate how this ends up in a compound
8 Okt 2009
I'm sorry you feel that way. Perhaps after looking at the following chart snip you'll think that you may have missed the boat.See how the daily chart shows solid support since March? March! Hello, it's a little too late to be skeptical. The question you have to ask yourself is why has the AUDJPY been performing so well and how long will it continue to do so.On another note, I'm going to start
7 Okt 2009
Did anyone notice this AUD tidbit?Unemployment fell to 5.7% from 6.0% against expectations of no change. The extremely strong job number will cement expectations that the RBA will continue to hike rates and perhaps be more aggressive in doing so.If you been following my blog this isn't going to be a surprise.As my last post said... buy on dips.
6 Okt 2009
It's very plausible that the RBA (Reserve Bank of Australia) has started the slow process of moving interest rates from emergency levels to normal.RBA Starts Rate RisesWe'll want to see what happens over the next couple of months in order to confirm this analysis. However, from now on whenever the markets are panicked about the latest downward surprise, it might be time to dip your toes in.We're
If you are wondering what is going on with the US economy, this puzzle piece from CNBC will fit in very nicely.Dunkelberg: You Can't See Main Street From Wall StreetWhat this is saying is that there probably is not a small business collapse in the works due to credit issues. Smaller businesses will simply wait until they see consumer spending before they bother to access credit.Personally, I am
5 Okt 2009
Without getting into detailed specifics I thought I'd try to answer a recent question about the strategies I'm trying with my various robots.First, a bit of background in case this is the first post you see on this blog:I design software and systems for a livingI've been trading for years -- learning through the heart of the downturn.With that out of the way I'd suggest looking at one of my posts
3 Okt 2009
Generally, I follow and prefer to trade the AUDJPY. It goes through unwinds from time to time as the bigger players suffer fits of risk aversion.For the last few weeks we've been bouncing back and forth between 77 and 80. On the way down, with all the gloom and doom blaring in the media, it feels like we must be about to fall off a cliff.It's difficult not to be scared. After all, anyone who
26 Sep 2009
As suggested in my last post...As a side note, I'm planning to make opposing robots this weekend. They will trade long and short positions in different sub-accounts.I've put together yet another robot. It will trade the same currency both long and short in separate sub-accounts. I'll have to wait until Monday or Tuesday to activate it.A few points I feel are worth mentioning:I've been developing
25 Sep 2009
I am following CNBC regularly (via their web site) these days. I see many of the pundits advocating panic and doom. I suspect they all want to be able to claim they were right when we finally do experience some type of pullback.However, these braying naysayers of doom really don't have much of import to say. All they really do is act as large forces on the emotions of market players. Everyone
Point-and-figure charts (P&F) is another way to represent the price charts that can be used in Forex trading. Conventional charts display the price as the linear function of time, which results in a demonstrative picture of how the market behaved during certain periods of time. But the problem is that the trader often doesn’t need to know how price depended on time, all he needs is to know what the prevailing force on the market is at the moment — bulls or bears, demand or supply. That’s where P&F charts come handy. They show the price changes graphically, independently on the time during which the changes have occurred.
For example, the simple point-and-figure chart could look like this:

The green X’s are the price increases (by some certain value) and the red O’s are the price decreases. A column of X’s represent an uptrend, while the column of O’s represents a downtrend. In each given column there can be only X’s or O’s. When one trend ends a new column starts. As you see, there is no time scale in this chart. Each column can last an indefinite period of time.
So, how are these point-and-figure charts drawn? To start drawing a point-and-figure chart you should first set two important parameter values of the chart — the box size and the reversal distance.
The box size is the height of each of the O’s and X’s in pips. For example, if you set a box size to 10 pips, each X will mean an upward movement by 10 pips, so a column of 6 X’s is an upward movement by 60 pips. The same would be correct for the O’s.
The reversal distance is the amount of boxes that should be passed by a price in a reverse direction for a trend to reverse (to start a new column). The most common reversal distance is 3. That means that on a rising trend (a column of X’s) a price has to go down by the amount of pips in three boxes for a new column (this time — of O’s) to start. For example, if you use a box size of 10 and a reversal distance of 3: the price goes up by 60 pips, you draw 6 X’s, then the prices goes down by 30 pips (that’s more than 3 × 10), you draw 3 O’s down starting a new column from the level below the last X. If the price would go down by less than 30 pips you wouldn’t have to draw anything new. Basically, after drawing an X or O you just wait for the price to continue going in the direction for a box size of pips or in a reverse direction for a reversal distance * box size of pips.
If we consider 10 pips box size and reversal distance of 3 for the image above then we can say that first the price goes up by 50 pips during the first uptrend, then it goes down by about 50 pips, then goes an uptrend for 70 pips, then go two equal bearish and bullish trends for 30 pips (exactly the reversal distance). Then a price declines by 50 pips, then goes up by 30 pips and finally falls by 40 pips. It ends at +10 pips (if you sum up all the values) and, as you see on the picture, the ceiling of the final O is 10 pips above the bottom of the first X. That’s exactly +10 pips. The «effective price» is located at the bottoms of the X’s and at the tops of the O’s.
Using the point-and-figure charts is simple. Almost all chart patterns and analysis techniques that work with the classic time-based charts work with the point-and-figure charts too. The trends are very easy to visualize in the P&F charts because the square dimensions of the boxes (X’s and O’s) form nice 45-degree angle trendlines. Look at the example:

Apart from the chart pattern analysis, P&F charts offer a sort of trading signals. When the trend direction changes, a new position can be opened in this new direction with a stop-loss equal to the reversal distance. But such trading technique requires some thorough optimization of the box size and the reversal distance for the given currency pair and the market conditions.
If you have any questions or comments regarding point-and-figure charting, feel free to reply in the commentaries to this post.
24 Sep 2009
Thursday was a very slow day.The market was down. The yen crosses took a dive. Everyone is getting antsy about stocks, news reports, and the month of September. OMG, the risk! My robot snoozed for much of the day and had little chance to earn anything useful.However, amidst all the whining I have to realize that being up about 4.5% for the week isn't so bad.Regardless, I did tweak things a
23 Sep 2009
Wednesday was a slow day.The AUDJPY was very quiet, which left little opportunity for my robot to extract revenue. In fact, with the DOW drop at the end of the trading day today we may be looking at a bit of a downward correction over the next little while.My robot is not very active during downward movements. So, I'll get bored, worry about long term profitability, and otherwise be motivated
22 Sep 2009
If you are a new visitor I should let you know I'm reviewing my own proprietary forex robot -- I'm not providing a general review of robots.The GoodProfitability continues. Sunday evening the robot earned 0.2% and over the course of Monday it earned 2.0% return. It's not obvious, but when capital is added to the robot old smaller positions provide less return when closed profitably. This means
20 Sep 2009
While not fully tested, as the market isn't open for trading, I have also completed both the meta-robot concept and a notification system.The meta-robot will look at the trades made via the current profitable robot and impose rules that require trades to open at a better price. The required difference, in pips, will be divided in two and added to the meta-robot's take profit point. For example,
18 Sep 2009
Now that the weekend is here it's time to put on the thinking cap and figure out how to increase earnings, reduce risk or both.As mentioned in a reply to a comment on the previous post I've reallocated funds, put in a reserve amount and added a manual release amount.The reserve amount holds back capital from the lot size calculation and the total margin available calculation. This capital is
16 Sep 2009
As you can see by my last few posts I've had a couple of trading robots slugging it out for the last few days.I'm happy to announce that the latest robot has absolutely thrashed my initial robot. Here are the recent earnings for this week:Sun 0.19%Mon 3.23%Tue 3.16%Wed 3.26%Obviously, I'm going to retire the previous robot, which earned at an average pace of approximately 0.5% per day, and
14 Sep 2009
Sunday evening I unleashed another trading robot. Here's how I set up my sub-accounts to do this in a reasonably safe manner.My initial or primary account is used to add or remove funds.Each robot trades in it's own sub-accountThis let's me track the returns for each robot in a trivial manner. It also means that each robot is 100% independent. If you do this be sure to name your sub-accounts
12 Sep 2009
If you are trading with Oanda, as I am, you are probably aware that you have to trade a fair amount before their monthly API fees are waived.However, there is an alternative. The first time I tried their platform, probably shortly after it was released, I didn't find it very inviting. However, about a month ago I tried again. Guess what? While I might not use the platform for discretionary
20 Agu 2009
I'm finally trading my own proprietary forex robot.The best part is that I have the sound of money chiming on my computer at work every time I have a position closed due to reaching it's take profit price.Anyway, no, I have no other hype to push.What I do have is the power of the robot mind to watch the market 24 hours a day. What do I mean? I mean that as long as my computer stays on and
27 Jul 2009
The drawdown is a very important property of any Forex trading report, strategy or expert advisor. The drawdown characterizes the risk of the employed strategy. Profitability of a given strategy should always be considered in couple with the drawdown because otherwise you won’t take the risk into account and that’s a very bad thing to do. Forex is a probability-based activity and thus should be treated from the risk/reward perspective.
The drawdown is a difference between some local maximum point in your balance chart and the next following minimum point in that chart. It’s the risk amount by which your strategy can go down during a streak of losses. There are two types of drawdown that are considered to be the important properties of expert advisors (for instance, in MetaTrader platform) — absolute drawdown and maximal drawdown.
Absolute drawdown is the difference between the initial deposit and the minimal point below the deposit level during all test period. It tells you how big your loss can become compared to the initial deposit during the trading. If this value was 0 during the test, then your deposit wasn’t at risk at all.
Maximal drawdown is the maximal difference between the local maximum extremum in your equity chart and the next local minimum extremum in your equity chart. It tells you how low your strategy can go after getting some profit. It can also be called a depth of a losing streak. Generally it’s a good idea not to trade with EAs with the maximal drawdown higher than the profit. But I don’t recommend trading even with strategies or expert advisors that have maximal drawdown at levels higher than 25% of the net profit. Mind your own risk-to-reward ratio and don’t trade with EAs that don’t comply with it.
Now you know what drawdown is and how it’s calculated in Forex trading. Unfortunately, the current version of MetaTrader 4 (Build 225), the strategy tester incorrectly calculates the drawdowns, so if you are testing your EAs, it’s better to calculate both the absolute drawdown and the maximum drawdown manually.
If you have your own opinion or questions about maximal or absolute drawdown, feel free to leave it in a comment to this post.
14 Jul 2009
Since the recent yen cross meltdown started I've been trying to keep from getting caught on the wrong side of any massive downward moves.As I generally trade only the AUDJPY, mostly on the long side, things have been pretty quiet!However, we are now facing some resistance at 74.50 on the 1hr -- which should be illustrative. We have done what might be a triple bounce off of support in the
30 Jun 2009
I've been shamelessly scalping the AUDJPY this week (via Oanda). It may be hard to fathom, at least when you see the numbers, but I'm not entirely happy with my results.Jun 28: 00.28% NAV+Jun 29: 06.65% NAV+Jun 30: 11.66% NAV+So far this week, if I can hang onto it, I'm up over 19% on my trading account.Now, you may be wondering why I'm not satisfied with my trading. Basically, I've made too
29 Jun 2009
26 Jun 2009
Well, it's been a while since I posted. Things have been hectic, but I did just take a short vacation. No running water. No cell phones. No internet. No trading. There were, however, lakes and fish.I think I'm ready to do some serious speculation at this point... as long as the market behaves.Hopefully I'll soon be posting and tweeting up a storm!We'll see.
9 Jun 2009
Here is the list of the Forex trading brokers with the favorable trading conditions and a decent reputation among the currency market participants. If you prefer flexible Forex trading conditions with little bureaucratic procedures, then these brokers are recommended for you:
FXOpen — one of the most popular MetaTrader Forex brokers with an easy entry limit and a really fast execution (they constantly invest into new trading servers):
InstaForex — known for their aggressive bonus and competition promotions, this broker offers extremely flexible leverage and has a very dedicated support:
FXcast — Forex broker that is famous for its multi-national and multi-lingual team with a support available in almost any language spoken:
Forex4you — ultimate decision for small-scale traders. With Forex4you you can trade even with cents:
FXOpen — one of the most popular MetaTrader Forex brokers with an easy entry limit and a really fast execution (they constantly invest into new trading servers):
- Welcome bonus system
- $1 to start trading
- WebMoney, LibertyReserve, CashU, E-Bullion and other payment options
- Traders’ contests with real bonuses
- 1-2 pips spreads on majors
InstaForex — known for their aggressive bonus and competition promotions, this broker offers extremely flexible leverage and has a very dedicated support:
- MetaTrader trading platform
- Flexible leverage — from 1:1 to 1:1000
- WebMoney, Moneybookers, e-Bullion and other payment methods
- Starter’s bonus — from $30
- Open account with only $1
FXcast — Forex broker that is famous for its multi-national and multi-lingual team with a support available in almost any language spoken:
- MT4 trading platform
- Leverage up to 1:400
- No slippage during high volatility periods
- Start trading with $10
- WebMoney, c-gold, LibertyReserve, StrictPay and many other e-currencies
Forex4you — ultimate decision for small-scale traders. With Forex4you you can trade even with cents:
- Deposit with WebMoney, LibertyReserve and other ways
- Ultra-micro lots — 0.0001 of a standard lot
- MetaTrader platform for trading
- Get paid an interest on your account balance
8 Jun 2009
Trading with the chart patterns can be easy if you know how to distinguish them and how to place the entry and exit orders correctly. There are many different chart patterns recognized by the expert financial traders. But in my opinion, in Forex trading there are five most important and rather frequently appearing patterns: ascending, descending and symmetrical triangles and rising and falling wedges. Here you will find the models of these patterns and their descriptions:
Ascending Triangle
Generally, it’s a bullish continuation pattern but the breakout in each direction is possible. If you like taking risk you can go long immediately after you spot this pattern. But if you want to be careful it’s recommended to wait until breakout appears in either side. The most important parts of the ascending triangle are the horizontal line and the upwardly sloping line. It’s also important for the price rate to touch each of those lines at least twice before breakout. This rule is vital for all of the 5 Forex chart patterns presented in this article. As you can see on the image, the price has touched the sloping line three times and the horizontal line two times and then broke out through the latter. Stop-loss should be placed slightly below the horizontal line. As the moderate pull-back is possible, consider placing stop loss near 70% level on the way from the sloping line to the horizontal one in place of the breakout. Take-profit should be placed according to the auxiliary sloping line, which runs from triangle’s top-left angle parallel to the main sloping line. Consider placing your target at the auxiliary line’s level in place of the breakout.

Descending Triangle
Generally, it’s a bearish continuation pattern but the breakout in each direction is possible. As with the previous pattern you can go short immediately after you spot it. Wait for breakout in either side to enter a high-probability position. The most important parts of the descending triangle are the horizontal line and the downwardly sloping line. The price rate should touch each of those lines at least twice before breakout. As the image shows, the price has touched the sloping line three times and the horizontal line two times and then broke out down. Stop-loss and take-profit levels are placed using the same principles as with the ascending triangle.

Symmetrical Triangle
Generally, it’s a continuation pattern that breaks out in the direction of the previous trend, but in practice breakout in every direction is possible. As always, you may decide to open a position in the direction of the previous trend immediately as you spot this triangle. If you wait for breakout then you have better chances of success. The most important parts of the symmetrical triangle are the downwardly and upwardly sloping lines and the horizontal line that bisects the angle created by the first two lines. The last line should be really horizontal (several degrees of error are allowable) or otherwise it’s some kind of a wedge but not a symmetrical triangle. As always, the price should touch each of the main sloping lines at least twice before breakout. Symmetrical triangle, which is shown on the image, breaks out downwardly after touching the bottom line three times and the top line multiple times. Stop-loss should be placed near 70% level on the way from the opposite sloping line to the horizontal line in the basement of the triangle (not the breakout point like before). Take-profit can be set near the auxiliary horizontal line, which runs from the top or bottom base angle (depends on the breakout direction) of the triangle and is parallel to the main horizontal line.
Rising Wedge
Usually, this chart pattern signals a reversal from the previous trend, but both upward and downward breakouts are possible. You can enter a risky trade immediately when you see this pattern. Wait for a clear breakout to enter a more probable trade. The crucial parts of the rising wedge are the two upwardly sloped lines that form a wedge. The price should touch each of them at least twice before breakout. On the image below you can see that the price touched top line two times and the bottom line multiple times. The downward breakout is shown. Stop-loss can be set at the auxiliary line that bisects the angle of wedge; set it near the level of the auxiliary line at the breakout. Take-profit is set near the auxiliary line (not shown on the image) that runs from the top or bottom base angle (depending on the breakout direction) of the wedge and is parallel to the opposite sloping line. E.g. in the picture’s example wedge the line should start at the bottom angle of the wedge and be parallel to the top sloping line. Take-profit should be placed near the level of that auxiliary line at breakout.

Falling Wedge
As its rising cousin, this chart pattern often signals a reversal from the previous trend, but both upward and downward breakouts are still possible. To enter a risky trade, open it immediately as you see this chart pattern. Wait for a clear breakout to enter a more probable trade. The main parts of the falling wedge are two downwardly sloped lines that form a wedge. The price should touch each of them at least twice before breakout. On the image you can see that the price touched the bottom line two times and the top line multiple times. Upward breakout is shown. Stop-loss and take-profit levels are set using the same principles as with the rising wedge.

If you have your own opinion or questions about Forex chart patterns, feel free to leave it in a comment to this post.
Ascending Triangle
Generally, it’s a bullish continuation pattern but the breakout in each direction is possible. If you like taking risk you can go long immediately after you spot this pattern. But if you want to be careful it’s recommended to wait until breakout appears in either side. The most important parts of the ascending triangle are the horizontal line and the upwardly sloping line. It’s also important for the price rate to touch each of those lines at least twice before breakout. This rule is vital for all of the 5 Forex chart patterns presented in this article. As you can see on the image, the price has touched the sloping line three times and the horizontal line two times and then broke out through the latter. Stop-loss should be placed slightly below the horizontal line. As the moderate pull-back is possible, consider placing stop loss near 70% level on the way from the sloping line to the horizontal one in place of the breakout. Take-profit should be placed according to the auxiliary sloping line, which runs from triangle’s top-left angle parallel to the main sloping line. Consider placing your target at the auxiliary line’s level in place of the breakout.

Descending Triangle
Generally, it’s a bearish continuation pattern but the breakout in each direction is possible. As with the previous pattern you can go short immediately after you spot it. Wait for breakout in either side to enter a high-probability position. The most important parts of the descending triangle are the horizontal line and the downwardly sloping line. The price rate should touch each of those lines at least twice before breakout. As the image shows, the price has touched the sloping line three times and the horizontal line two times and then broke out down. Stop-loss and take-profit levels are placed using the same principles as with the ascending triangle.

Symmetrical Triangle
Generally, it’s a continuation pattern that breaks out in the direction of the previous trend, but in practice breakout in every direction is possible. As always, you may decide to open a position in the direction of the previous trend immediately as you spot this triangle. If you wait for breakout then you have better chances of success. The most important parts of the symmetrical triangle are the downwardly and upwardly sloping lines and the horizontal line that bisects the angle created by the first two lines. The last line should be really horizontal (several degrees of error are allowable) or otherwise it’s some kind of a wedge but not a symmetrical triangle. As always, the price should touch each of the main sloping lines at least twice before breakout. Symmetrical triangle, which is shown on the image, breaks out downwardly after touching the bottom line three times and the top line multiple times. Stop-loss should be placed near 70% level on the way from the opposite sloping line to the horizontal line in the basement of the triangle (not the breakout point like before). Take-profit can be set near the auxiliary horizontal line, which runs from the top or bottom base angle (depends on the breakout direction) of the triangle and is parallel to the main horizontal line.

Rising Wedge
Usually, this chart pattern signals a reversal from the previous trend, but both upward and downward breakouts are possible. You can enter a risky trade immediately when you see this pattern. Wait for a clear breakout to enter a more probable trade. The crucial parts of the rising wedge are the two upwardly sloped lines that form a wedge. The price should touch each of them at least twice before breakout. On the image below you can see that the price touched top line two times and the bottom line multiple times. The downward breakout is shown. Stop-loss can be set at the auxiliary line that bisects the angle of wedge; set it near the level of the auxiliary line at the breakout. Take-profit is set near the auxiliary line (not shown on the image) that runs from the top or bottom base angle (depending on the breakout direction) of the wedge and is parallel to the opposite sloping line. E.g. in the picture’s example wedge the line should start at the bottom angle of the wedge and be parallel to the top sloping line. Take-profit should be placed near the level of that auxiliary line at breakout.

Falling Wedge
As its rising cousin, this chart pattern often signals a reversal from the previous trend, but both upward and downward breakouts are still possible. To enter a risky trade, open it immediately as you see this chart pattern. Wait for a clear breakout to enter a more probable trade. The main parts of the falling wedge are two downwardly sloped lines that form a wedge. The price should touch each of them at least twice before breakout. On the image you can see that the price touched the bottom line two times and the top line multiple times. Upward breakout is shown. Stop-loss and take-profit levels are set using the same principles as with the rising wedge.

If you have your own opinion or questions about Forex chart patterns, feel free to leave it in a comment to this post.
28 Mei 2009
While reading a recent CNBC article about current events something clicked for me.Here is the passage:The dollar rose broadly on Thursday as yields on 10-year U.S. government bonds jumped more than 50 basis points in the last two weeks, drawing Japanese investors into overseas assets like global semi-conductor stocks, banks and U.S. junk bonds, according to Reuters.Do you remember the massive
Have you been following people involved in fx trading on twitter?Have you noticed how many people are happy to tell you what happened? While macroeconomic news and previous day post analysis can be useful, it certainly doesn't help you make a trading decision based on current charts. I have a little proposal to make.Instead of tweeting that you've opened a long or short position provide some
The AUDJPY currency pair is currently trading around the 76.00 mark.Over the last twenty days, from May 7 through May 27, I've been experimenting with a concept I've been calling microtrading.I don't intend to close all of my positions at the moment, but if I did my account NAV would increase by more than 10% over that period.While I realize that active trading can return spectacular results
26 Mei 2009
I've become a little frustrated with most of news sources out there. If you've been an active forex trader for any length of time you'll notice that talking heads are always trying to tell you why something happened.That's really nice, and might possibly help you learn about various financial interactions, but it's absolutely useless from a trading point of view. If you are trading you need to
In short, there isn’t any. Not like the Forex trading is completely unregulated, but there isn’t such thing a SEC (Securities and Exchange Commission) for the Forex market. There is no central location and the company that would own the market (like NYSE Euronext owns New York Stock Exchange). Decentralization of the modern foreign exchange market is its greatest advantage and one of its biggest problems. And while the market itself remains unregulated the market participants are, in fact, regulated by various authorities, depending on the country where the given participant resides or does his business.
NFA (National Futures Association) and CFTC (Commodity Futures Trading Commission) are obligatory regulating organizations for the Forex brokers that are based in United States or want to legally deal with the U.S. residents. While spot Forex trading has nothing to do with the futures or commodities, these organizations set the rules for how the retail Forex market should work in United States. Some of the rules protect the traders (e.g. by setting high own capital requirements for the brokers) and some just make traders’ life harder (e.g. the tons of documentations required to register with a broker and the latest no-hedging rule). Anyway, traders (even those from U.S.) still have the option not to trade with the NFA-registered brokers, so, there’s nothing bad in having such institutions as NFA or CFTC.
FSA (Financial Service Authority) regulates the Forex brokers that are based in U.K. or are dealing with the British traders. The U. K. regulation is much lighter than the one in U.S., so traders usually find no difference when they are dealing with the FSA-registered broker. If you want a regulated U.K. broker, just look if it’s registered with FSA. But don’t expect it to be much more reliable than the unregulated brokers.
SFBC (Swiss Federal Banking Commission) requires all Forex brokers that are based in Switzerland to obtain the real Swiss banking license and thus become a regulated banking institution. That’s a good thing for those traders that are registered with the Forex brokers that got such license, because Swiss banking regulation is one of the best in the world and those institutions that fulfill all the requirements can be certainly considered reliable. On the other hand, obtaining such a license is a long and expensive way; this fact is making some of the Forex brokers to move out of Switzerland.
Some Forex brokers are regulated by the European and other banking laws as they are registered as the banking institutions in the respective countries. Such brokers can be considered the most reliable ones, but for the common retail trader dealing with them isn’t easy as they usually require high minimum account deposit and a lot of paperwork.
The majority of other regulatory bodies provides almost no strict requirements for the Forex brokers and is plainly nominal. If you see a broker registered on Seychelles or British Virgin Islands, or some other «offshore zone» it doesn’t mean that it’s thoroughly checked and audited. Of course, it doesn’t also mean that it’s a scam broker. Some Forex brokers prefer to stay offshore for a lot of advantages and some traders prefer those brokers for their own reasons. When you choose your broker, be sure to select the one with the appropriate type of regulation that fully fits your trading needs.
If you have your own opinion or questions on Forex market regulation, feel free to leave it in a comment to this post.
19 Mei 2009
I blogged about this idea not too long ago. The concept is to use very small trades relative to your available margin and net asset value (NAV). I'm doing this with the AUDJPY pair so that when I accumulate positions I am earning a positive carry trade return.My trade size over the last week has been such that the margin involved in each trade is 0.2% of my NAV. That's tiny. Twenty five
6 Mei 2009
As I often do, especially when the markets are excruciatingly slow in determining when to make the next significant move, I've been thinking about Forex.Take a mental walk with me...The DOW falls from 10,000 to 5,0000 and loses 50% of it's value. It returns from 5,000 to 10,000 and gains 100% of it's value.Wait, think about that for a minute. In the normal world having the ability to gain
While I don't have any pictures to show, yet, I am working on an EA that trades AUDJPY based on the market price relative to the average price of positions held.The first few passes at this type of system were pitiful. My testing starts from September of last year to now while only opening long positions. As you can imagine this is a difficult period of time for a long only system!However, late
1 Mei 2009
I've been thinking about grid based strategies designed to take advantage of volatility without incurring great risk.The idea is that the strategy be followed using a carry trade pair in the event that you do inevitably end up holding some positions. You'll want a platform with a decent spread. Oanda often has about a 3.0 pip spread on the AUDJPY pair -- my current pair of choice.So, let's
29 Apr 2009
Okay, it's working.I have Oanda running a single FXTrade window while I'm open in another browser typing this blog post.Here is what I did to get this working:Close down extra charts -- only the basic platform window is running.Eliminate extra currency pairs -- only follow two or three active pairsShrink the window -- show everything but in as small a footprint as it practical.With these steps I
I recently bought the Dell Mini 12 thinking it would be noiseless, so that I could leave it on overnight while I slept. I tend to wake up from time to time so that would be an easy way to check for Forex opportunities during the night.Unfortunately, running the Oanda FxTrade application causes the system to grind to a halt. Right now my profile automatically opens multiple charts (1 min, 15 min
28 Apr 2009
Well, I spent last evening tracking down some problems in my next foray into programming expert advisers.It turns our that a simple logical test was using an '&' instead of an '&&' between two terms.This little horseshoe nail caused some position closing attempts to fail with an error 138 -- meaning that the price being used to close the position was too far away from the market price.I also ran
26 Apr 2009
Yesterday's experiments with creating an expert advisor to scalp the 5 minute chart show great profits and great risk.I've been working to reduce the level of risk without taking away the reasonable chance of making reasonable profits.Here is the most recent chart:This is running from 01-Feb-2009 to 25-Apr-2009 and obviously surviving any ups and downs during that period.I'm still not happy with
25 Apr 2009
Well, it's the weekend, what else is a grown man to do?I had an inspiration for an (overly) aggressive expert advisor today. Basically, it's a simple buy low and sell high machine using oscillators.Scope out the chart. It does fairly well for a period of time and then when the market finds it's achilles heel it is undone.All is not lost. I have some ideas for improving the aggression factor as
23 Apr 2009
The cable, as the GBPUSD is called, looks like drunken sailor.The chart is all over the map, with massive daily swings lined up one after the other all over the place.There are some pips to be made in there!I'm not generally trading the GBPUSD, but I'm going to put a few moments into figuring out whether my AUDJPY chart set up seems applicable.It's hard to resist all that volatility.
The market has about 6 minutes to change it's mind.If it doesn't, this is going to look like a tweezer top on the 1 hour.Now, that would be something I'd consider bearish (I originally typed bullish).If you read my last post... you know I'd like that to happen!Now about 4 minutes left.Zzzz. No market reaction on the hour.Maybe the tails weren't long enough -- or I'm too impatient?... continuing .
It might be time to think about shorting the AUDJPY.It's coming up to a recent high and might not have a lot of legs left.If we get a decent failure there could be a shorting opportunity for some part of this evening.See (on the 1 hour)?Let's keep an eye on this...... continuing ...Down on the 1 minute chart we seem to have some resistance to get through before we have the ability to drop:...
Well, first, I can't believe I'm awake this early after such a long night. I need to hone my craft and trade for a living -- I'd be able to keep better hours.Anyway, this morning we have the follow up to last nights analysis.We're looking at what appears to be a double bottom with no idea whether or not we'll reap the technical rewards that they can offer.Since I slept through the last several
Well, I should be sleeping, but since I'm not I thought I'd take another look at the charts.Guess what -- it's the same chart but I see something new!Okay, sure, a bit more time has passed. However, with the added points I clearly see that we seem to be consolidating.There should be some money to be made while we bounce around... and then some money to be made when a direction is chosen.As ever,
22 Apr 2009
My last blog post, audjpy decision point, talked about an upcoming decision point. At the moment it looks like we are going to begin an upward leg.I'm feeling particularly cautious at the moment, especially since this is only on the 15 minute chart, but I thought I'd post it.Notice the last candlestick:As I'm long term bullish on AUDJPY let's hope this is the beginning, or perhaps resumption, of
I'm looking at the 3HR chart at the moment. We seem to be looking at an impending strike on a recent support line.If this resistance holds we might have a technical setup that would allow for a nice gain.Take a look:See how there was something of a W shape starting in the middle of the 19th? See how the chart is currently on the second touch down of a second W? If we bounce off the support line
20 Apr 2009
I often think that evening trading goes through a period of doldrums. It gets boring. Things move slowly, if at all. Ten pips gain or loss can take an hour or more to happen.Zzzz.At the moment, as you can see by the chart below, I'm waiting for the current trendlet to break:This is a 1MIN chart, hence the "trendlet" concept.
After the downward move, see the last post, we are now poised to either bounce off the previous low or sink down.In other words, either result provides opportunity.Here's another snap of the 1MIN showing the AUDJPY bouncing just above the recent low of 68.06 (as shown by the yellow support lines drawn under the candlesticks).Take a look, make your call, set a good stop if you know how......
I was watching the AUDJPY as it slid downward today.As you might expect it was following a nice trend on the way down. It's currently following a nice trend line on the way up too.Here's a 1MIN chart showing the upward movement from the 68.06 bounce.I don't really place a lot of stock (heh, bad pun) in the 1MIN but it's interesting nonetheless.... continuing ...This is getting more interesting:A
Well, did anyone notice what happened based on the forex analysis I posted over the weekend.The EURUSD, posted here, indeed moved upwards a bit before resuming it's downtrend.The AUDJPY, posted here, with a followup here, broke it's support line and henceforth fell like a stone.Nice. While I obviously am not able to say which way it will go in advance, it seems I was able to pinpoint the action
19 Apr 2009
Though I'm a bit leery of Sunday price action it looks like a fairly long term support line is being broken.This could be interesting.... continuing ...Looking closer, this may not yet be a break, as there have been previous "breaks" which gives us a bit of leeway here. A redraw based on a previous "break" leaves a bit of breathing room still.... continuing ...Waking up at 5:30am I see that
If you've been following along you'll notice that I keep mentioning that I am long term bullish on the AUDJPY.One of the reasons is that I think we've seen the worst of the panic and risk aversion. Another reason is that I think we're now closer to a recovery and following period of economic expansion than a lot of people expect.Given these two thoughts, and the following chart, it's easy to see
18 Apr 2009
I don't generally trade the EURUSD but since it's the weekend I seem to have some extra time on my hands.Here are a series of charts, in varying timeframes, that I'd use to get a general feel for this currency pair.First, let's look at the 1D chart to see what's happened over the long term. I've compressed the chart a fair amount in order to get it to fit into a single snapshot -- you should be
I don't really have anything new to add since Forex markets are closed for the weekend.We are still constrained within what appears to be a consolidation pattern. We are approaching the end of the pattern and the bollinger bands on my 1hr chart are collapsing.I've also got a nifty new screen snipping tool that I wanted to try out... ;)While I do remain long term bullish there is a lot of noise
17 Apr 2009
The range of price movements has been shrinking.Or, as generally considered from a technical analysis point of view, the bollinger bands are collapsing.Your guess is as good as mine as to the direction it will go, but usually when the bollinger bands collapse the currency will have completed it's consolidation and start a reasonable move up or down.Given that it's a Friday I'd have to say be
Well, we didn't really do much at all yesterday after bouncing off of a support line a couple of times.What does this mean?This means that the AUDJPY currency pair isn't currently behaving in a way that makes it easy to interpret. This means that we need to be careful.I have no idea what the market will do... except that it will either go up or down at some point.
16 Apr 2009
Finally, after suggesting all day long that I'm looking for upward movement it's finally here.How long will it last? Who knows. Will it hit the top of my so-called consolidation zone? Don't know.Anyway, here's the latest from my chart...I'll be happiest if the pair zooms up like a rocket, but I'll lock in some profit if we get close to the resistance line.
I didn't have time to post another update during the day, but things have been pretty slow anyway.Here you can see that the AUDJPY has not yet broken out of the trend lines (that I have shown in early charts).I'm not sure what is going to happen during the Asian session, but as ever, I'm hoping for some bullish action.I'm sure you can see the market honoring the trend line by bouncing off it?
I'm sitting here watching the slow, achingly slow, decline in the AUDJPY.Based on RSI and stochastic evidence, not shown on the image below, it's very possible that we'll get an upturn soon.Anyway, this image shows you that we are continuing to approach what I've called a containment field. It represents a possible consolidation zone while the market tries to figure out whether to ultimately
It looks like we are going to test the containment of the possible AUDJPY consolidation zone I mentioned previously.Frankly, I had expected the market to hold up better to the news concerning jobs and housing, but then, if I could accurately predict what would happen I wouldn't be speculating would I?In any case, if we get an upward bounce around 70.75 - 70.85 then we are still in what I consider
It's likely, with the bad jobs and housing starts news this morning, that risk aversion will come into play.Basically, the AUDJPY is a good indicator of fear in the markets these days.With all that said, I'm still going to watch closely for a bounce of the potential support line. That is likely to be the point that the market decides to rally or collapse for the day.... continuing ... I don't
It's nearly 9:00am EST and we didn't drop low enough to get a real double bottom. We may have begun a consolidation process between 73.50 and 70.25 while the market figures out whether the next move is up or down.We'll have to see whether we continue to have lower highs and higher lows.If we are consolidating, then it's not hard to spot the support and resistance lines that will be likely to
I've been having some success calling the shots on the AUDJPY charts.This morning we've been having a correction from yesterday's highs. While I've been hearing scuttlebutt on twitter concerning shorting the carry trades, I remain upward biased.My view, the current drop in price is setting us up for a possible double bottom or simply a W shaped chart. Simultaneously, I do see some stochastic and
15 Apr 2009
Sweet. I've got a support line around ~70.60 that is approximately where the market bounced back into upward movement.If you follow my ramblings on Twitter you'll see me making noises about a rebound in the works... and it came about while I was asleep.It's a very good feeling to have the market respect your charts and signals. Too bad it doesn't happen all that often.No time to look into
14 Apr 2009
Today we see the crux of the issue.The AUDJPY has suffered a pullback. A return to recent highs gives us the possibility of a double top. A bounce off the recent low gives us the possibility of the a double bottom. There may be more complex structures at play as well, but you get the idea.This is risk point. This is an opportunity point.If you get in, say with a long position right now, you
13 Apr 2009
At the moment things are looking bullish for the AUDJPY.I popped in another small position a few moments ago and so far it's been north from there. If things turn around I'll wait for a good low and then play the game where I replace higher longs with lower longs.Obviously, though I don't expect another huge currency collapse, I'll still have to play it cautiously. You never can tell what might
9 Apr 2009
As I mentioned a couple of days ago, I have been working on sinking some smaller positions while the AUDJPY was going sideways (or suffering a slow decline).Today is the day that this bears fruit. Trading lower positions for higher positions now has me with some sunk positions that I can unload at a decent profit as the AUDJPY continues to spike.
8 Apr 2009
A few days ago I was saying that perhaps the AUDJPY would pull back after it's very fast rise up into the 71.xx range.It continued rising to somewhere around 72.80 instead. However, early last night it was bumping down around the 70.00 mark. Was that my correction?My three hour (I trade with Oanda) shows leg room all the way to 68.xx if it's thinking about correcting.That's the trick with Forex
7 Apr 2009
So, it looks like we've had several days of sideways motion on the charts. I don't mind at all.As long as you buy on the low end and sell on the high end these are good times to play in the market too.For periods of non-trending action I like to watch the stochastic and RSI indicators. The stochastic are reasonable but they do give a ton of false signals. The RSI can help corroborate their
The MetaTrader 4 is possibly the most recognized and efficient home broker trading application nowadays on the market. It is free and available for download from the MetaQuotes Software Corporation website, the producer of MetaTrader 4. If your broker offers the possibility of having MT4 as your main trading platform, it will be likely to provide a download link directly when you sign up for your trading account. Even if many brokers have their own platforms, MT4 it is still a powerful and reliable tool for Forex, stock, and commodity traders. If your broker doesn’t support MT4, you can freely access real data from several servers on MT4, the currency pair rates differ a bit from MT4 servers and your broker, but it is not something that will significantly affect your trading performance.
Once you have successfully downloaded and installed the MT4 software, launch it. It may seem a bit complex for beginners, but all the information is very clear and divided by windows that allow you to control all your orders and a different number of pairs simultaneously. From the Market Watch feature, normally positioned on the top left size, under the menu bar, you have all the pairs available on the server, and with a click and drag mouse movement you can make that pair to appear in any of your chart windows, making it easier and faster to switch from one pair to another, and you, as trader, know how decisive can time be, when you have more than one order opened, mainly during news and market events.
One of the best features that MT4 offers is the option to create templates that fit better each and every trader needs. The profiles can have one or multiple charts. For example, 3 EUR/USD charts with different timeframes, or 3 different pair charts, in which you can totally customize them using the indicators of your choice. From colors to templates, the MetaTrader 4 offers the trader full interaction with his orders, which is often not possible in many broker platforms.
The main disadvantage that MT4 has against other web-based trading platforms is the fact that you have to download it. Many traders have to often check their orders from different places, such as: office or university. So if your broker only offers the MT4 or other downloadable software, it can be quite complicated for you to manage your orders, if you fall into this category. The optimal situation would be the possibility of using MT4 while you are on your computer, and at the same time, the option to open or close orders through your browser, in situations where aren’t using your computer.
Finally MetaTrader 4 is, doubtlessly, a tool that every Forex trader should at least download and be familiar with, in most of the cases, you will make it part of your trading experience, considering its features, for the moment, MT4 has a wide superiority against other trading software.
2 Apr 2009
Though I had expected a downturn before the pop... the long flat period today in the 71.xx range clued me in to a possible spike.When the 15 min bollinger bands tightened up and the price popped above it, the clinch was in.I hopped on with a couple tiny positions, nearly instantly protected by stop losses, and grabbed a few pips on the spike.Now the question is, will the uptrend continue or will
Did you ride the recent run in the AUDJPY to 71?I was lucky enough to grab and hold a chunk at 65.62 and I'm pondering whether or not I want to let it go.We've just had a double top on the 15 minute chart. The 1 hour is oversold. I think we are going to get some bounces upward due to exuberance, but it seems about time for a pullback.I've sold off the nibbles I also acquired on the way up. I
23 Mar 2009
Heiken Ashi (or Heikin Ashi, Heikin-Ashi) is the method of representing the charts using the Japanese technique of the balanced bars. Compared to the traditional Japanese candlestick charts the Heiken Ashi charts are more easily read, provide clearer picture of the market and allow easy trend spotting. What is good about this method is that it’s included into the standard set of the MetaTrader 4 indicators. You can find it there under the Custom submenu. I won’t explain how to calculate those candlesticks here because MT4 does it all automatically for you and you don’t have to worry about how those candles are drawn. Here I will tell you how to use Heiken Ashi in trading the trends. You can see the example Heiken Ashi chart:

As you see, white bodies are the uptrend candles and the red bodies are the downtrend candles. The upper shadows are usually absent on the downtrends and the lower shadows are absent when the trend is going up. There are 5 Heiken Ashi scenarios for trends:
That’s all you have to know to trade on the trends successfully if you are using Heiken Ashi charting method. But I also recommend reading some other article on Heiken Ashi if you want to learn more about using it.

As you see, white bodies are the uptrend candles and the red bodies are the downtrend candles. The upper shadows are usually absent on the downtrends and the lower shadows are absent when the trend is going up. There are 5 Heiken Ashi scenarios for trends:
- Trend is normal. Rising white bodies signal ascending trend and falling red bodies signal descending trend.
- Trend is getting stronger. Rising longer white bodies with no lower shadows for ascending trend; falling longer red bodies with no upper shadows for descending trend.
- Trend is getting weaker. Candle bodies become shorter and for ascending trends lower shadows occur, for descending trends — upper shadows.
- Trend consolidation. Small candle bodies with both upper and lower shadows.
- Trend is changing (not accurate signal). Very small candle body with long upper and lower shadows.
That’s all you have to know to trade on the trends successfully if you are using Heiken Ashi charting method. But I also recommend reading some other article on Heiken Ashi if you want to learn more about using it.
17 Mar 2009
I can hardly believe it myself, but last week my NAV gains totaled 97.5%, which is entirely incredible. Too bad I'm such a small participant.No, unfortunately, this had nothing to do with my recent forays into developing an expert advisor. It seems that I've stumbled across some charting factors that provide me some measure of insight into market movements.The market doesn't always behave, but
7 Mar 2009
Here is a bit of code that demonstrates what I've been blogging about. It's a simple way to manage pending position requests. The idea is that a signal his been raised but that this code will let you wait for an improvement in the price before actually opening a position.// *******************************************************************// Name: AMS_PEND.MQ4// Date: 01-Mar-2009// Prog: Rookie
6 Mar 2009
Finally, the weekend is almost here. I've been stealing a few moments here and there during the week but it's not that productive.Basically, I've limited myself to testing various "opening" strategies. What I've found is that I can increase earnings across the test set -- but generally at the expense of a bigger draw down. I'd like to come up with a system that tests out a tripling of the
With most Forex brokers when you leave a currency pair position open over the night you’ll get a swap or an interest payment for it. It can be positive (you actually gain money) or negative (you lose money). That payment is usually very small and the majority of the beginning traders just don’t pay any attention to it, since their direct profit or loss from the trading is much greater than this rollover interest. But why do the brokers pay and take this overnight interest payment or swap? And why do some brokers promote interest-free accounts?
The origin of the overnight interest is the fact that in the retail Forex market the physical delivery of the currencies is absent. If you buy €100,000 with your leveraged $1,000 the broker won’t transfer those €100,000 to your bank account. But you’ve paid $100,000 for those euros, even if you borrowed them from your broker. So, if the Forex broker doesn’t deliver the currency to you they technically borrow it from you. In the abovementioned example you borrow $100,000 from the broker and the broker borrows €100,000 from you. And where you have the debt and the loan, there you have the interest rates. The interest rates for the overnight interbank lending (and that’s what you are doing when trading Forex on leverage) are set by the central banks. For example, the rate that you pay for borrowing the dollars from your broker is set by the Federal Reserve System, while the interest rate that the broker pays to you for borrowing the euros from you is set by the European Central Bank. The difference between those two rates is the final overnight interest or swap rate.
Let’s look at this rate calculation. You buy a standard lot (100,000 units) of EUR/USD with your account being in the U.S. dollars with the leverage of 1:100. The current Fed rate is 0.25% and the current ECB rate is 1.5%:
What would happen if you didn’t buy that standard lot of EUR/USD but went short on it instead? You’d have to pay that difference to your broker.
The problem is that in reality brokers don’t pay or take the exact amounts for the overnight interest. They minimize the swap if they pay it out and maximize if you do. That way they try to avoid the risks. But that’s certainly not very fair.
Why do some of the brokers claim that they don’t pay or take overnight interest? Because the interest is viewed inappropriate by one of the most popular religions in the world — Islam. Some Forex brokers offer interest-free accounts by request and charge a fixed commission per trade to compensate their interest-based losses. Some brokers provide only interest-free accounts and usually don’t charge any commissions in that case.
How can you gain advantage from the overnight interest? First, you can use it for carry trade. When you feel that the currency pair with the big positive interest rate difference is going to remain stable or move in your favor for a long period of time you can use the broker’s leverage to receive some ridiculously high interest rate from the swaps only. Another way is to open an account with two brokers — one that offers no-interest policy and another — with the common Forex broker. This way you can hedge your positive interest rate difference position with the no-interest rate position on another broker. In this case you won’t be bothered by the market movement but at the same time you will gain advantage from the positive overnight interest. Of course, such practice is usually considered illegal by the brokers with no swaps, so, I wouldn’t recommend using it.
The origin of the overnight interest is the fact that in the retail Forex market the physical delivery of the currencies is absent. If you buy €100,000 with your leveraged $1,000 the broker won’t transfer those €100,000 to your bank account. But you’ve paid $100,000 for those euros, even if you borrowed them from your broker. So, if the Forex broker doesn’t deliver the currency to you they technically borrow it from you. In the abovementioned example you borrow $100,000 from the broker and the broker borrows €100,000 from you. And where you have the debt and the loan, there you have the interest rates. The interest rates for the overnight interbank lending (and that’s what you are doing when trading Forex on leverage) are set by the central banks. For example, the rate that you pay for borrowing the dollars from your broker is set by the Federal Reserve System, while the interest rate that the broker pays to you for borrowing the euros from you is set by the European Central Bank. The difference between those two rates is the final overnight interest or swap rate.
Let’s look at this rate calculation. You buy a standard lot (100,000 units) of EUR/USD with your account being in the U.S. dollars with the leverage of 1:100. The current Fed rate is 0.25% and the current ECB rate is 1.5%:
- You use $1,000 as the margin.
- You borrow $100,000 from your Forex broker.
- You buy €100,000 with the borrowed money.
- You lend €100,000 to your broker (because it won’t deliver the currency to you, anyway).
- You need to pay 0.25% yearly or 0.00068% daily for your borrowed $100,000.
- Your Forex broker needs to pay 1.5% yearly or 0.00411% daily for its €100,000 borrowed from you.
- In the end, the broker needs to pay the difference between €4.11 and $0.68 for each day that your position is open. That’s your positive swap or overnight interest.
What would happen if you didn’t buy that standard lot of EUR/USD but went short on it instead? You’d have to pay that difference to your broker.
The problem is that in reality brokers don’t pay or take the exact amounts for the overnight interest. They minimize the swap if they pay it out and maximize if you do. That way they try to avoid the risks. But that’s certainly not very fair.
Why do some of the brokers claim that they don’t pay or take overnight interest? Because the interest is viewed inappropriate by one of the most popular religions in the world — Islam. Some Forex brokers offer interest-free accounts by request and charge a fixed commission per trade to compensate their interest-based losses. Some brokers provide only interest-free accounts and usually don’t charge any commissions in that case.
How can you gain advantage from the overnight interest? First, you can use it for carry trade. When you feel that the currency pair with the big positive interest rate difference is going to remain stable or move in your favor for a long period of time you can use the broker’s leverage to receive some ridiculously high interest rate from the swaps only. Another way is to open an account with two brokers — one that offers no-interest policy and another — with the common Forex broker. This way you can hedge your positive interest rate difference position with the no-interest rate position on another broker. In this case you won’t be bothered by the market movement but at the same time you will gain advantage from the positive overnight interest. Of course, such practice is usually considered illegal by the brokers with no swaps, so, I wouldn’t recommend using it.
3 Mar 2009
Okay, I've got a few EA components under my belt now.First, I've made myself a trivial system to determine potential entry points. Basically, this system raises a signal when the price is above or below a moving average for some period of time and then crosses over. Remember, I'm only concerned about making an easy to manage framework at this point.Second, signals raised above are tossed into a
2 Mar 2009
I was able to put some serious effort into developing an expert adviser over the weekend. At this stage I believe I can build something that will be both relatively safe and profitable. This is not an easy task!Anyway, I do want to assure you that I have no intention of ever selling an EA. If it works I'll use it for myself. If it doesn't work, then I'd have nothing worth selling in any case.
26 Feb 2009
I'm finding it takes a lot more time to program an EA than I would expect. Alternately, perhaps I am dumb enough to think that I could just throw together some ideas and have a profit machine?Anyway, after another night of testing I have some new software that is able to detect or indicate various conditions.I'm hoping that doing enough visual testing will clue me in enough, personally, to the
25 Feb 2009
Believe it or not I think I'm going to use a simple moving average crossover as a signal for my automated trading system.Obviously, and testing verifies this, there are two issues to manage:1) Getting whipsawed.2) Entering the trend too late.I believe that I can at least alleviate these issues somewhat. Technical indicators can provide clues about whether or not the market is currently trending
24 Feb 2009
As I develop and test more expert advisers I see just how tricky it is to translate common sense into a series of hard and fast rules.In short, my adviser does stupid things!When I trade Forex on my own I'll combine a "feel" for the current situation along with some technical indicators. For example, in recent times, if something funny is going on, then the market I'm trading almost always takes
23 Feb 2009
I love the fact that I can program the MT4 system. However, wouldn't it be nice if there was documentation in English? Well, yes, there is some, but it obviously wasn't written by somebody who speaks it fluently.Anyway, I spent much of the weekend fooling around with some custom expert advisers. One or two had promise, but obviously if it was easy to do then everyone would be doing it. It
19 Feb 2009
I've signed up for a second account. This one is at a broker that uses a dealing desk and an MT4 based trading platform.Why?Because I write software for a living. Because I sometimes have a decided lack of discipline. Because my life is stressful and I don't need to be glued to my screen worrying about charts, margins and limits.No, really, it's because I'd like to think that I can create a
14 Feb 2009
Part 2 of Elliott Wave International’s expansive NEW Deflation Survival eBook is online now. The free 60-page eBook is packed with Robert Prechter's most important teachings and warnings about deflation. This is one of the most valuable resources EWI has ever offered at no cost. Learn more below or download it now – for free.
……………
Greetings,
We contacted you earlier this week to tell you about an exciting, free 60-page eBook our friends at Elliott Wave International have just put together.
The new eBook is compiled from Bob Prechter’s most important teachings and warnings about deflation.
Much like Prechter’s wildly popular Independent Investor eBook, this new Deflation Survival eBook will transform the way you think – about inflation and deflation.
Most financial experts were caught completely of guard by the real estate top in 2005. Many thought the Dow Industrials index would sour well beyond its 14,000 peak. Others saw weakness in U.S. stocks but said the dollar would also crash and hyperinflation would immediately ensue.
Only ONE analyst, that we know of, made the following forecasts:
- Real estate, stocks and commodities would all top.
- A monumental credit crisis would reduce lending and borrowing around the world.
- The dollar would rally.
- Deflation would reign across almost all asset classes.
That analyst’s name is Robert Prechter.
Prechter – a man who’s made the arduous journey from fame to outcast and back – has scoured his complete writings on deflation and compiled the most important into a special 60-page Deflation Survival eBook.
Until today, most of the forecasts and advice in this still-prescient eBook have been released only to Prechter’s faithful subscribers. Now the 60-page Deflation Survival eBook can be yours for free.
Learn more about this unique opportunity by following the link below.
10 Feb 2009
I'm getting into this small position size infrequent trading style.For example, with a pittance of my capital at risk I am earning nearly a 5% annual return. What am I trading? I'm holding the ever popular AUDJPY carry trade pair of course.Even with the recent wildfires in Australia I really don't see them falling off the map completely. Come on, realistically, how low can their dollar sink?
3 Feb 2009
Well, my days have become very busy as of late. I go to work early, come home late, and need to get some sleep when I am not swamped with the normal day to day duties of life. I need time to cook and clean, pay the bills, service the car, look after my home, watch the superbowl, do laundry, and so on.While I've been making money I certainly am not making enough money to hire someone to look
2 Feb 2009
Emotions are the one of the greatest problems of the Forex traders. Almost every beginning trader, who starts with the demo account, experiences a great success in his trading, but fails to carry this success to the real money account. What’s the problem? Emotions! When we lose we feel frustration and sometimes even despair. Winning can cause us to lose control over our actions and turn our trading into a gambling or cause a serious overtrading. So here are the four easy steps to stop emotions from ruining your Forex trading:
- Single loss is not your fault. It’s not even the market’s fault. And it’s not your system’s fault. It’s just a loss. No trader or system can guarantee 100% winning rate. So, losses should happen. If you lose then your system works. It may even lose again, but that won’t change the full picture. Trading doesn’t work with a single loss or win; it works with the loss rate and risk-to-reward ratios. So, next time you lose, remember that there is no one to blame, because there is no guilt in losing.
- If the losses prevail over the winning positions then check your risk-to-reward ratio first. If each of your losses is less than a third of your single winning position then maybe your system is intended to work with 65% of your positions in the red zone? If your risk-to-reward ratio doesn’t compensate your poor loss-to-win ratio, you still don’t have to blame yourself, the market or your system. Probably, it’s just the wrong system for the market you are trading in. Time changes and the old systems stop working, while the new ones are created. Just switch to something else and continue your pursuit of success.
- Single winning position is not an indicator of your success. The same as with the losses don’t treat a single win as your accomplishment. It’s just a part of the routine process of trading Forex.
- If your winning rate is high during the long period of time and the risk-to-reward ratio is rather low then I can congratulate you with finding the right strategy that worked fine for the kind of market you were trading on during that period. That’s it! Stick with it until your winning rate declines below the satisfying level. Then look at the number 2.
27 Jan 2009
The Forex trading is already a very popular kind of the accessible financial trading. It’s now more like a «people financial trading» with many traders treating it as some kind of the «home business» opportunity. The popularity of the on-line Forex trading (and the popularity of the Forex was insignificant before the on-line era) has began rather recently — about 8-9 years ago. Every new year brings us new changes and developments. What will be the future of the Forex market?
It may seem almost impossible but the Forex market will become even more popular than it is now. A lot of people has already heard about the Forex, but know little about it and never tried trading. If the past several years were dedicated to informing people about the Forex, the next few years will be about getting as many people as possible to actually try trading Forex, at least on demo. The increasing popularity will lead to an increased amount if the related information — analysis, trade ideas, systems, strategies, expert advisors, etc. People will start discussing Forex not only at the dedicated forums and chatrooms, but at the unrelated meetings and parties.
The trends will become less distinctive. The large amount of participants will mean a faster and more flexible reaction to the global events — like natural disasters, acts of terrorism, war conflict outbreaks, commercial news and so on. The volatility will rise also because of the wider range of the systems, strategies and the analytical reports.
The stricter regulation will also influence the market participants, attracting more conservative traders. The unregulated Forex brokers will also remain popular though because some traders will value the cheapness and the easiness of trading more than the comfort of being protected by the state’s laws.
Paid systems and strategies will continue to flourish despite the fact that the free similar version will be widely available. The new marketing techniques will do their work enriching all those who decide to create their own paid «get rich with Forex scheme».
15 Jan 2009
Here's my bold prediction for you in 2009!
You will break your trading resolutions by the end of February.
True, statistics cover populations and not individual traders. The fact is, its traders who are outside of th enorm and trade with focused discipline that really achieve their financial goals. When is now the time to re-focus with discipline and dedication and really commit yourself to your trading plan?
Today is January 15, 2009 and February is just around the corner.
Let this be your wake-up call!
Be honest with yourself and focus with the discipline of a seasoned trader on staying true to your trading plan or risk becoming a statistic!
Happy "Disciplined" Trading!!
ForexJourney.com
You will break your trading resolutions by the end of February.
- You will abandon your trading plan
- You will fall into the same destructive trading patterns you resolved to change
- Your account will earn the same or less than in 2008
True, statistics cover populations and not individual traders. The fact is, its traders who are outside of th enorm and trade with focused discipline that really achieve their financial goals. When is now the time to re-focus with discipline and dedication and really commit yourself to your trading plan?
Today is January 15, 2009 and February is just around the corner.
Let this be your wake-up call!
Be honest with yourself and focus with the discipline of a seasoned trader on staying true to your trading plan or risk becoming a statistic!
Happy "Disciplined" Trading!!
ForexJourney.com
9 Jan 2009
A Free Trading Video From the World's Largest Market Forecasting Firm
This video lesson features Elliott Wave International Senior Currency Analyst, Jim Martens, demonstrating how you can use Elliott wave analysis to identify opportunities in your Forex trading.
This is just a short excerpt. For a limited time, you can access the full $79 online trading course, FREE. Visit Elliott Wave International for your free access.
You'll get all the details behind the analysis you see in this video preview.
Happy Trading!!
Forex Jourey
This video lesson features Elliott Wave International Senior Currency Analyst, Jim Martens, demonstrating how you can use Elliott wave analysis to identify opportunities in your Forex trading.
This is just a short excerpt. For a limited time, you can access the full $79 online trading course, FREE. Visit Elliott Wave International for your free access.
You'll get all the details behind the analysis you see in this video preview.
|
Happy Trading!!
Forex Jourey
8 Jan 2009
Something to keep in mind when you consider where the currency markets will be heading in 2009.It appears that the Obama stimulus package will contain a $250,000 write off for business expenses. This is huge. Smaller businesses, when generating expenses, are not generally spending their money outside of the US. Vehicles, machinery, tools, raw goods or whatever else is eligible for this tax
FOREX RethinkThough I've been trading the AUDJPY on a 15m chart quite a bit, and with reasonable success, I am thinking about moving to a larger time frame. Well, to be accurate, it's not so much that I plan to use a different chart. What I really want to do is accumulate positions over a longer period of time.Do you know why?Because, if I can accumulate a bunch of positions that are at some
Langganan:
Komentar (Atom)