Tampilkan postingan dengan label forex strategy. Tampilkan semua postingan

29 Agu 2011

On your path to becoming a profitable trader, you will test many different methods for entering and exiting trades. At some point you may find a method which works pretty well for you and which you feel comfortable using. You may take a lot of great trades using this method, only to find that one day your method just stops working. What happened? Did your system break? Will you have to start all over?

Sometimes the answer to questions like this is simpler than you might expect. A lot of traders pay attention to entry triggers like moving average crossovers, price action patterns, and other indicators lining up on their charts, but don’t pay as much attention to what the market is doing on a given day. The market does slowly transform, and like any other living system it will evolve with time. Some things about Forex will never likely change, but others are sure to do so. The “mood” of the market can change considerably as the years go by, and a system which worked great in one context may fail in another—or simply need an adjustment to keep working.
If you are in a situation like this and your system has abruptly “failed,” you may want to ask yourself if this is what has happened to you. Has the economic climate changed substantially since you were last profitable? If so, then perhaps the context around your trades has stopped being quite as optimal as it once was. You may have been placing trades in an excellent context before without even knowing it or attempting it by complete coincidence. And now that the context isn’t as great, your trades aren’t working out.
Here are some questions to consider. Ask yourself, “Am I trading against the trend?” This can often work against you. “Am I trading in a choppy market?” Choppiness kills a lot of traders. If there are a lot of fake outs, sometimes you need to take a break and wait for the market to even out a bit before you come back in. “But I’ll have to wait forever,” you might say. If this is the case, then look at more currency pairs. If you only trade a couple of pairs, and great setups are coming half as often in the current market climate, then think about looking at twice as many pairs each day. This phase of the market, like all others, will pass. It doesn’t mean your system is broken, it just means that right now it’s a little harder to make it work than usual. All traders face this sometimes. Once in a while you may indeed find you need to go back to the drawing board, but more often than not it’s a waste of time to start all over. If what you have makes sense and it works often enough, than you probably should just adapt to the market conditions and stick with what you’ve got.

Develop a technique to find the best setups in the best locations. Great Forex traders point out that finding excellent setups is like using a rifle, not a shotgun. They’re right—good trades don’t take good setups, they take great setups.

27 Jul 2009

The drawdown is a very important property of any Forex trading report, strategy or expert advisor. The drawdown characterizes the risk of the employed strategy. Profitability of a given strategy should always be considered in couple with the drawdown because otherwise you won’t take the risk into account and that’s a very bad thing to do. Forex is a probability-based activity and thus should be treated from the risk/reward perspective.

The drawdown is a difference between some local maximum point in your balance chart and the next following minimum point in that chart. It’s the risk amount by which your strategy can go down during a streak of losses. There are two types of drawdown that are considered to be the important properties of expert advisors (for instance, in MetaTrader platform) — absolute drawdown and maximal drawdown.

Absolute drawdown is the difference between the initial deposit and the minimal point below the deposit level during all test period. It tells you how big your loss can become compared to the initial deposit during the trading. If this value was 0 during the test, then your deposit wasn’t at risk at all.

Maximal drawdown is the maximal difference between the local maximum extremum in your equity chart and the next local minimum extremum in your equity chart. It tells you how low your strategy can go after getting some profit. It can also be called a depth of a losing streak. Generally it’s a good idea not to trade with EAs with the maximal drawdown higher than the profit. But I don’t recommend trading even with strategies or expert advisors that have maximal drawdown at levels higher than 25% of the net profit. Mind your own risk-to-reward ratio and don’t trade with EAs that don’t comply with it.

Now you know what drawdown is and how it’s calculated in Forex trading. Unfortunately, the current version of MetaTrader 4 (Build 225), the strategy tester incorrectly calculates the drawdowns, so if you are testing your EAs, it’s better to calculate both the absolute drawdown and the maximum drawdown manually.

If you have your own opinion or questions about maximal or absolute drawdown, feel free to leave it in a comment to this post.

8 Jun 2009

Trading with the chart patterns can be easy if you know how to distinguish them and how to place the entry and exit orders correctly. There are many different chart patterns recognized by the expert financial traders. But in my opinion, in Forex trading there are five most important and rather frequently appearing patterns: ascending, descending and symmetrical triangles and rising and falling wedges. Here you will find the models of these patterns and their descriptions:

Ascending Triangle
Generally, it’s a bullish continuation pattern but the breakout in each direction is possible. If you like taking risk you can go long immediately after you spot this pattern. But if you want to be careful it’s recommended to wait until breakout appears in either side. The most important parts of the ascending triangle are the horizontal line and the upwardly sloping line. It’s also important for the price rate to touch each of those lines at least twice before breakout. This rule is vital for all of the 5 Forex chart patterns presented in this article. As you can see on the image, the price has touched the sloping line three times and the horizontal line two times and then broke out through the latter. Stop-loss should be placed slightly below the horizontal line. As the moderate pull-back is possible, consider placing stop loss near 70% level on the way from the sloping line to the horizontal one in place of the breakout. Take-profit should be placed according to the auxiliary sloping line, which runs from triangle’s top-left angle parallel to the main sloping line. Consider placing your target at the auxiliary line’s level in place of the breakout.

Ascending Triangle

Descending Triangle
Generally, it’s a bearish continuation pattern but the breakout in each direction is possible. As with the previous pattern you can go short immediately after you spot it. Wait for breakout in either side to enter a high-probability position. The most important parts of the descending triangle are the horizontal line and the downwardly sloping line. The price rate should touch each of those lines at least twice before breakout. As the image shows, the price has touched the sloping line three times and the horizontal line two times and then broke out down. Stop-loss and take-profit levels are placed using the same principles as with the ascending triangle.

Descending Triangle

Symmetrical Triangle
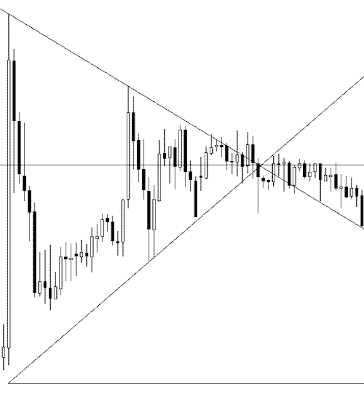
Generally, it’s a continuation pattern that breaks out in the direction of the previous trend, but in practice breakout in every direction is possible. As always, you may decide to open a position in the direction of the previous trend immediately as you spot this triangle. If you wait for breakout then you have better chances of success. The most important parts of the symmetrical triangle are the downwardly and upwardly sloping lines and the horizontal line that bisects the angle created by the first two lines. The last line should be really horizontal (several degrees of error are allowable) or otherwise it’s some kind of a wedge but not a symmetrical triangle. As always, the price should touch each of the main sloping lines at least twice before breakout. Symmetrical triangle, which is shown on the image, breaks out downwardly after touching the bottom line three times and the top line multiple times. Stop-loss should be placed near 70% level on the way from the opposite sloping line to the horizontal line in the basement of the triangle (not the breakout point like before). Take-profit can be set near the auxiliary horizontal line, which runs from the top or bottom base angle (depends on the breakout direction) of the triangle and is parallel to the main horizontal line.

Symmetrical Triangle

Rising Wedge
Usually, this chart pattern signals a reversal from the previous trend, but both upward and downward breakouts are possible. You can enter a risky trade immediately when you see this pattern. Wait for a clear breakout to enter a more probable trade. The crucial parts of the rising wedge are the two upwardly sloped lines that form a wedge. The price should touch each of them at least twice before breakout. On the image below you can see that the price touched top line two times and the bottom line multiple times. The downward breakout is shown. Stop-loss can be set at the auxiliary line that bisects the angle of wedge; set it near the level of the auxiliary line at the breakout. Take-profit is set near the auxiliary line (not shown on the image) that runs from the top or bottom base angle (depending on the breakout direction) of the wedge and is parallel to the opposite sloping line. E.g. in the picture’s example wedge the line should start at the bottom angle of the wedge and be parallel to the top sloping line. Take-profit should be placed near the level of that auxiliary line at breakout.

Rising Wedge

Falling Wedge
As its rising cousin, this chart pattern often signals a reversal from the previous trend, but both upward and downward breakouts are still possible. To enter a risky trade, open it immediately as you see this chart pattern. Wait for a clear breakout to enter a more probable trade. The main parts of the falling wedge are two downwardly sloped lines that form a wedge. The price should touch each of them at least twice before breakout. On the image you can see that the price touched the bottom line two times and the top line multiple times. Upward breakout is shown. Stop-loss and take-profit levels are set using the same principles as with the rising wedge.

Falling Wedge

If you have your own opinion or questions about Forex chart patterns, feel free to leave it in a comment to this post.

23 Mar 2009

Heiken Ashi (or Heikin Ashi, Heikin-Ashi) is the method of representing the charts using the Japanese technique of the balanced bars. Compared to the traditional Japanese candlestick charts the Heiken Ashi charts are more easily read, provide clearer picture of the market and allow easy trend spotting. What is good about this method is that it’s included into the standard set of the MetaTrader 4 indicators. You can find it there under the Custom submenu. I won’t explain how to calculate those candlesticks here because MT4 does it all automatically for you and you don’t have to worry about how those candles are drawn. Here I will tell you how to use Heiken Ashi in trading the trends. You can see the example Heiken Ashi chart:

Heiken Ashi Chart Example

As you see, white bodies are the uptrend candles and the red bodies are the downtrend candles. The upper shadows are usually absent on the downtrends and the lower shadows are absent when the trend is going up. There are 5 Heiken Ashi scenarios for trends:
  1. Trend is normal. Rising white bodies signal ascending trend and falling red bodies signal descending trend.
  2. Trend is getting stronger. Rising longer white bodies with no lower shadows for ascending trend; falling longer red bodies with no upper shadows for descending trend.
  3. Trend is getting weaker. Candle bodies become shorter and for ascending trends lower shadows occur, for descending trends — upper shadows.
  4. Trend consolidation. Small candle bodies with both upper and lower shadows.
  5. Trend is changing (not accurate signal). Very small candle body with long upper and lower shadows.

That’s all you have to know to trade on the trends successfully if you are using Heiken Ashi charting method. But I also recommend reading some other article on Heiken Ashi if you want to learn more about using it.

2 Feb 2009

Emotions are the one of the greatest problems of the Forex traders. Almost every beginning trader, who starts with the demo account, experiences a great success in his trading, but fails to carry this success to the real money account. What’s the problem? Emotions! When we lose we feel frustration and sometimes even despair. Winning can cause us to lose control over our actions and turn our trading into a gambling or cause a serious overtrading. So here are the four easy steps to stop emotions from ruining your Forex trading:

  1. Single loss is not your fault. It’s not even the market’s fault. And it’s not your system’s fault. It’s just a loss. No trader or system can guarantee 100% winning rate. So, losses should happen. If you lose then your system works. It may even lose again, but that won’t change the full picture. Trading doesn’t work with a single loss or win; it works with the loss rate and risk-to-reward ratios. So, next time you lose, remember that there is no one to blame, because there is no guilt in losing.
  2. If the losses prevail over the winning positions then check your risk-to-reward ratio first. If each of your losses is less than a third of your single winning position then maybe your system is intended to work with 65% of your positions in the red zone? If your risk-to-reward ratio doesn’t compensate your poor loss-to-win ratio, you still don’t have to blame yourself, the market or your system. Probably, it’s just the wrong system for the market you are trading in. Time changes and the old systems stop working, while the new ones are created. Just switch to something else and continue your pursuit of success.
  3. Single winning position is not an indicator of your success. The same as with the losses don’t treat a single win as your accomplishment. It’s just a part of the routine process of trading Forex.
  4. If your winning rate is high during the long period of time and the risk-to-reward ratio is rather low then I can congratulate you with finding the right strategy that worked fine for the kind of market you were trading on during that period. That’s it! Stick with it until your winning rate declines below the satisfying level. Then look at the number 2.

22 Sep 2008

Apart from being potentially profitable, Forex market becomes more dangerous nowadays. There many scams in the Forex industry and they vary in types and scales. If you want to start trading Forex you should know a lot about such scams to avoid losing your hard-earned money. And if you are the experienced Forex trader you’ve probably already got hurt from some Forex scam and if not — you should also know about Forex scams to avoid them in the future.
  • Forex broker scam. It was very popular several years ago, but its popularity seems to fade now. Usually it’s just some set-up Forex broker site that promises the good trading conditions and offers some basic «bucket-shop» trading simulation to attract large customer base and run away with their money. Just do your research on a broker before depositing money and you’ll be safe from such scams.
  • Forex strategies selling. There are hundreds «successful» Forex trading strategies selling on the Internet. Many traders tend to believe that they can spend $300 on such a strategy and become rich with it. In reality the best thing that money can buy is education. Sold strategies are usually nothing but crap. Not only they won’t make you rich, they will probably make you lose your account margin.
  • Forex e-books selling. Overrated and hyped e-books with a lot of marketing and a little use (if at all) are the actual problem of many industries. Forex e-books selling for ridiculously high prices and promising to tell you «the best kept secrets of the millionaire traders» are nothing but wasted money. You’d better lose that money in Forex trading, trying to find your own strategy and getting some real practice.
  • Scam Forex managed accounts. Some people like the idea of Forex, but don’t like to trade on this market, they prefer to invest in it. That’s where managed accounts come to play. It’s a good idea to have some company or a private trade to trade for you and earn a share of profit. But unfortunately there also scam players here. They will just take your money and disappear. Some scam managers will probably even pretend that they are really trading and will show you some profit, hoping that you’ll deposit more. Don’t fall for such scams, thoroughly research your manager or better invest in some reputable managing company.

11 Sep 2008

Before you switch to your own Forex trading system or the one that you’ve bought from someone else, I’d suggest you organizing the process in such way that you’ll be able to keep up with your strategy and track your success honestly. Developing a trading system is a hard process, but keeping to it without falling to emotional trading is even harder. Here is a list of the steps I recommend doing when you find your system:
  1. If your strategy uses technical indicators directly or there are indicators that can help you spot entry/exit points exist, write them down and add them to the chart. Avoid adding indicators that are not used by your system.
  2. Write down and open in your trading platform the timeframes on which your system is tested. Don’t try trading on the timeframes that don’t work with it.
  3. Define your entry and exit conditions — whether they depend on indicators or something else, those should be definable conditions. Avoid using something else except your system’s guidelines in your trading.
  4. Before each trade, calculate the position size depending on the risk that is tolerable with your strategy. This will help you with money management and will save you from overtrading or gambling.
  5. Follow your strategy writing down all your profits and losses. Be honest with yourself. If you avert from your initial strategy, try to record that too.
  6. Keep to your system without changing it for a significant amount of time. Try to see its weak and strong sides when you have enough statistics on your hands.
Over three years that I’ve spent trading Forex I developed many trading strategies. The majority of them were crap, but many of the strategies were unjustly abandoned by me, because I’ve failed to use them correctly — continuously modifying the system, «cheating» myself and forgetting to record statistics killed more than one successful strategies.

14 Jul 2008

Trading on the short-term periods at the Forex market is often considered a more popular practice than the long-term trading. In short-term trades your positions usually don't last longer than a day, while in the long-term trading they can remain open for years. Although, I prefer to trade on the long-term charts and hold my positions open for the long periods of time, the short-term Forex trading has its advantages:
  1. You can trade on thousands of opportunities when the currency rates change with a high volatility. You can capture every swing — up or down, trade inside the ranges and channels. Even the sideways market can be traded in short-term. When you trade long-term you miss these opportunities.
  2. You don't have to tie up your funds for the long periods of time. Your margin capital is locked only for the short periods and you can even get it out of the trading account if you really need it and then put it back and continue trading without any problems. In long-term trading your money gets caught into positions for months.
  3. The majority of the Forex trading signals work only for the short-term trading. Usually both technical and fundamental signals are played out in several hours of trading on the Forex market. The number of signals and events that influence currency rates on the long-term scale is really minimal.
This is what you get if you like to trade inside the day and use such techniques as breakout trading, scalping, news trading, range trading and any other short-term strategy. Of course there are also some disadvantages in the short-term trading, but they are not the topic of this post.

Archives

 
Twitter Facebook Dribbble Tumblr Last FM Flickr Behance